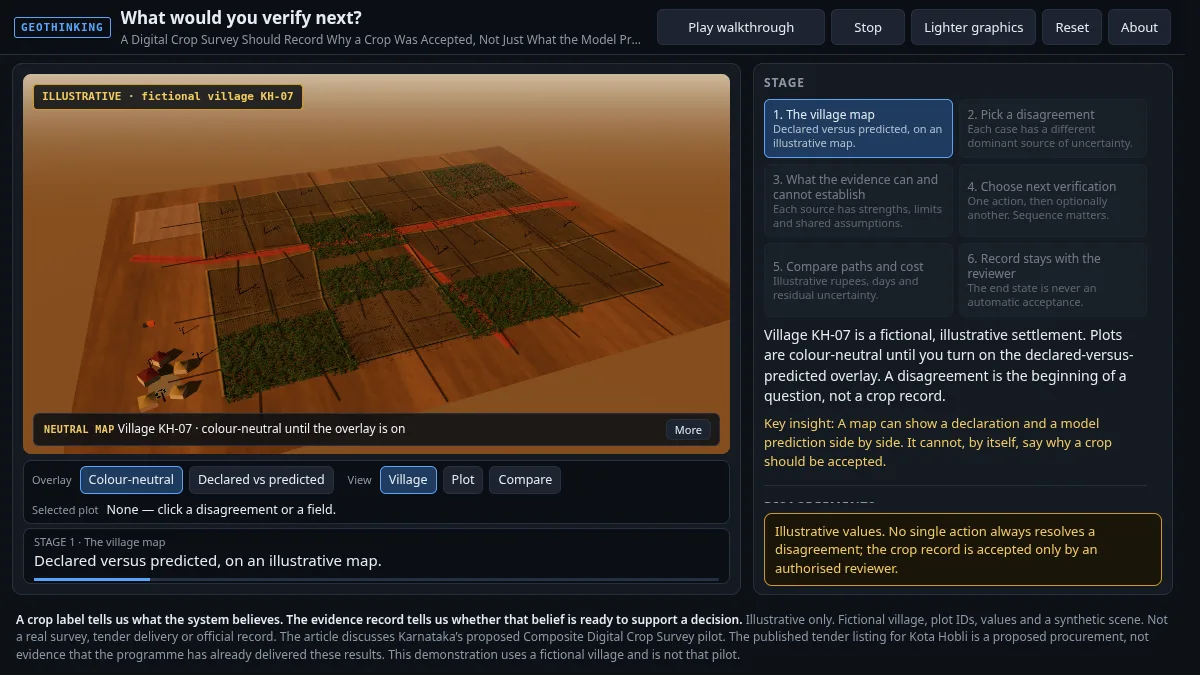
What Would You Verify Next?
An interactive GeoThinking piece on why a digital crop survey should record why a crop was accepted, not just what the model predicted.
Open interactive → Start a conversation
GeoThinking Interactive
Interactive 3D and visual explainers that accompany the GeoThinking newsletter. Orbit the scene, step through the story, and test the decision for yourself.
An interactive GeoThinking piece on why a digital crop survey should record why a crop was accepted, not just what the model predicted.
Open interactive →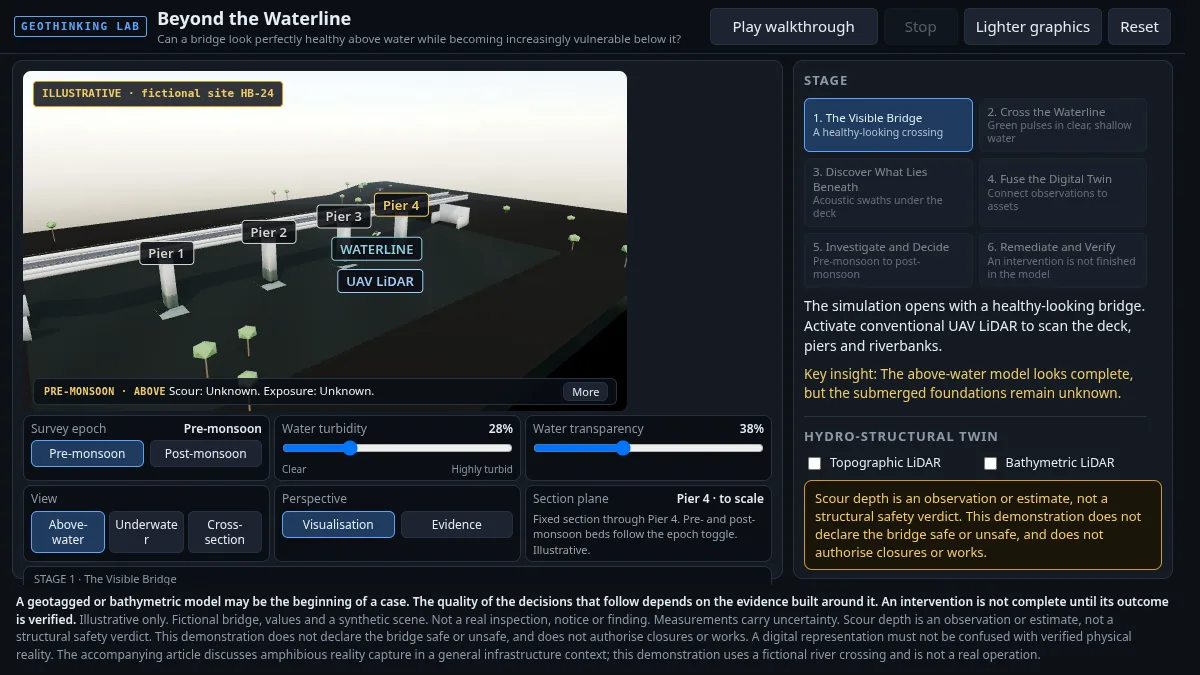
An interactive GeoThinking piece exploring a hydro-structural digital twin and what it can and cannot tell you about a structure below the waterline.
Open interactive →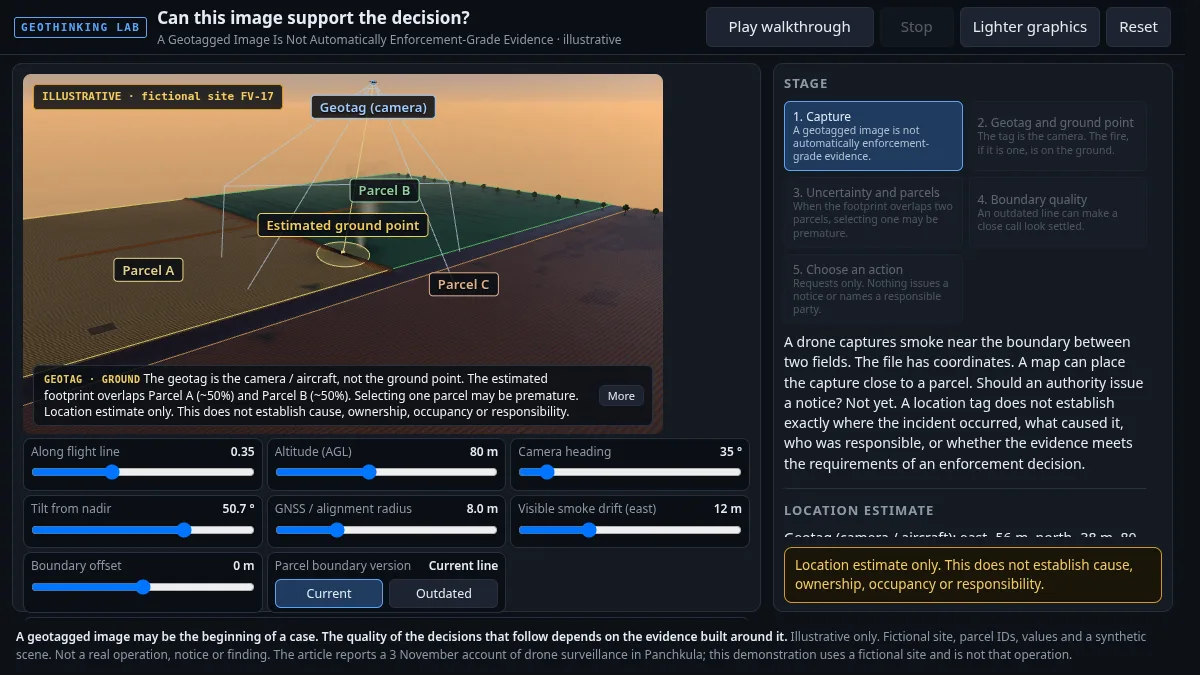
An interactive GeoThinking piece on why a geotagged image is not automatically enforcement-grade evidence.
Open interactive →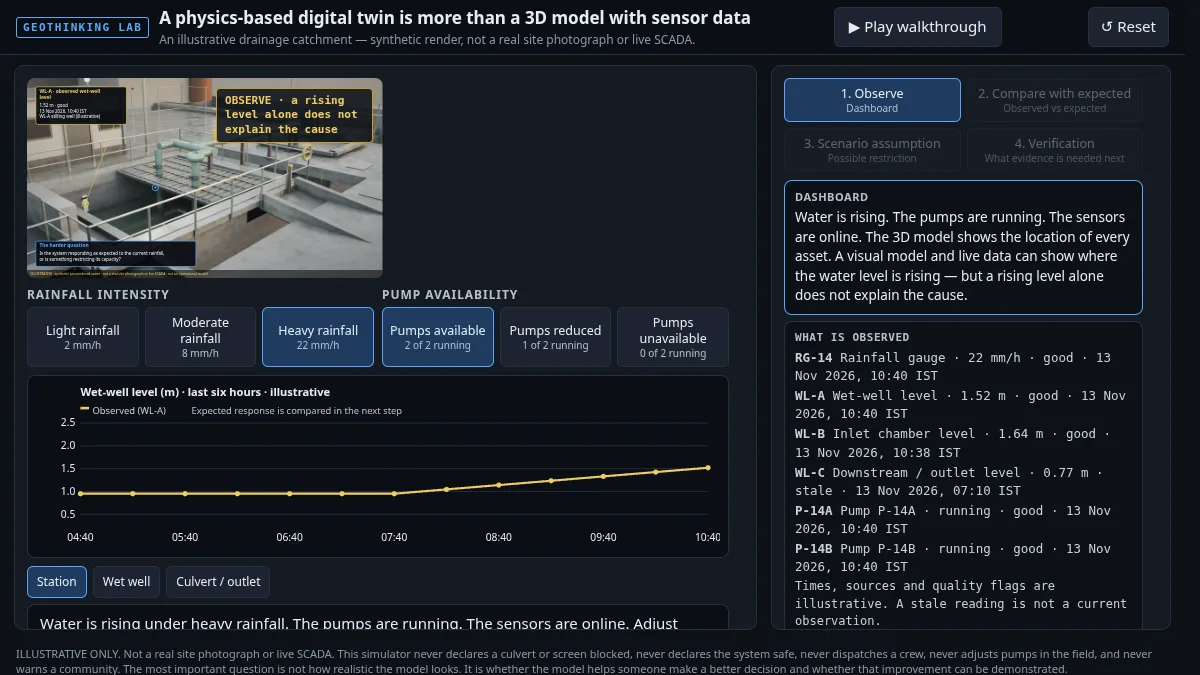
An interactive GeoThinking piece on what makes a physics-based digital twin more than a 3D model with sensor data attached.
Open interactive →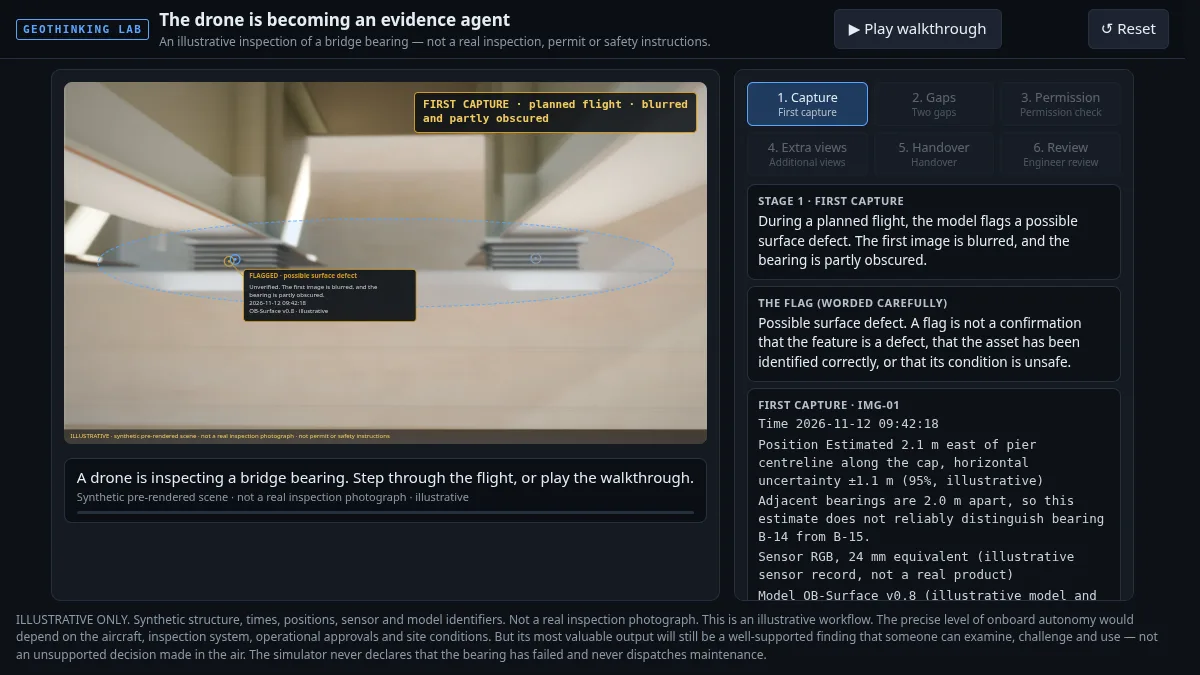
An interactive GeoThinking piece on how a drone is becoming an evidence agent, not just a camera in the air.
Open interactive →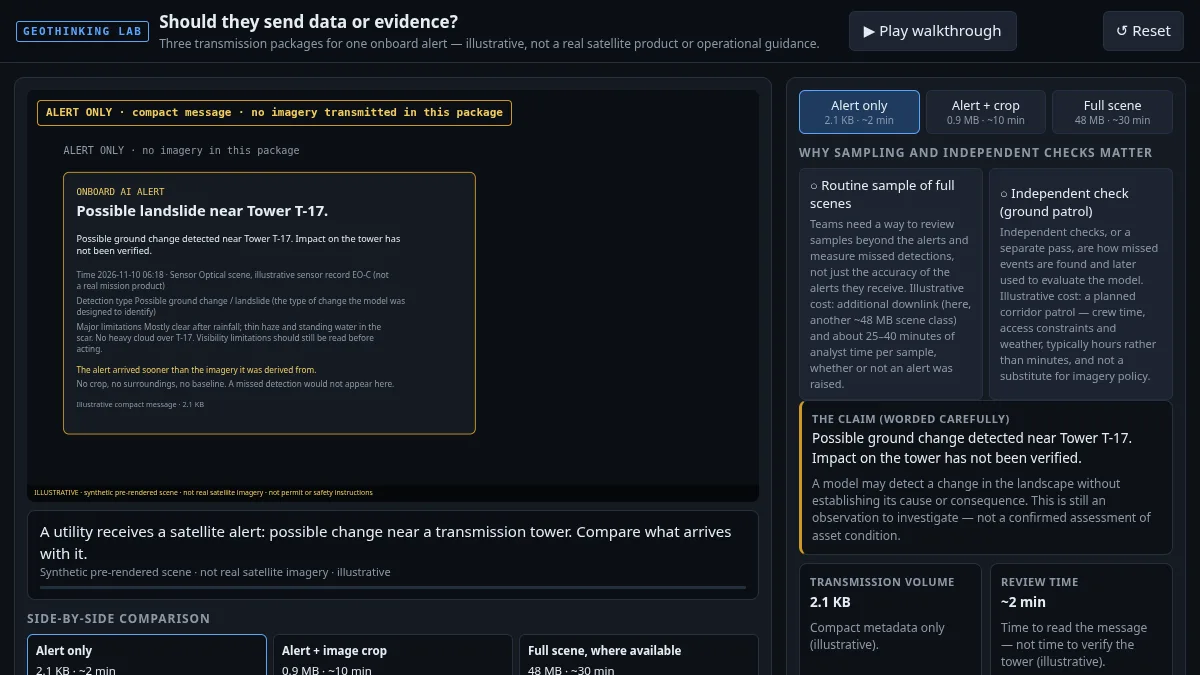
An interactive GeoThinking piece on whether satellites running onboard AI should send raw data or evidence back to the ground.
Open interactive →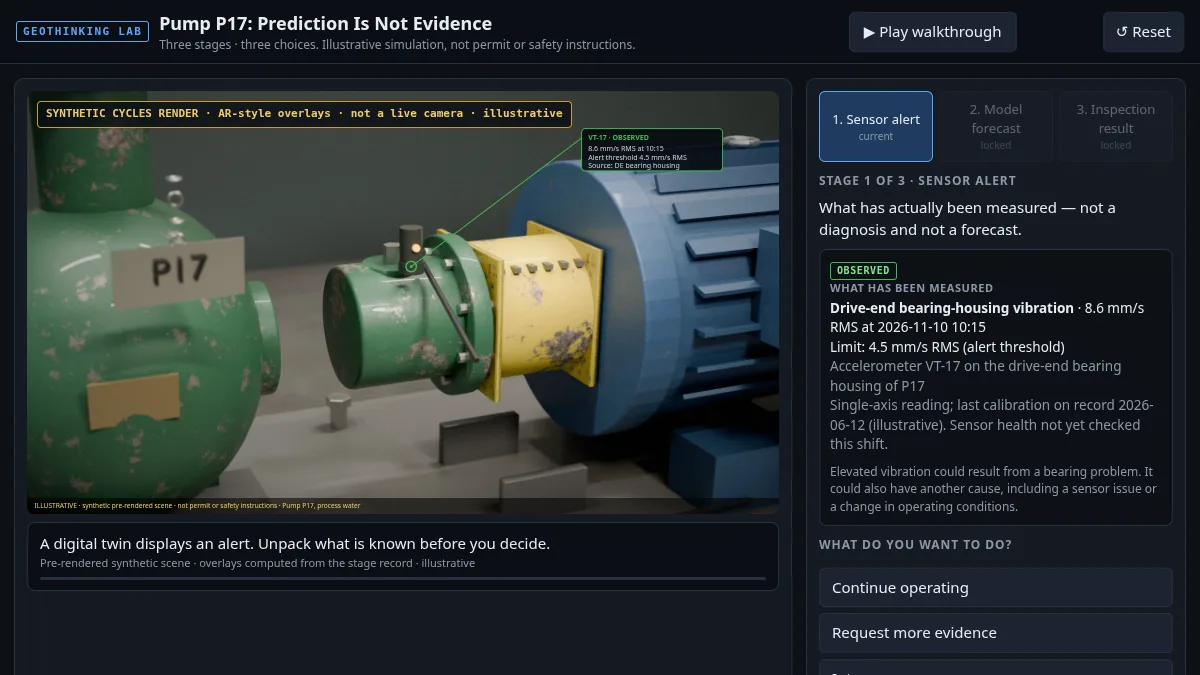
An interactive GeoThinking piece on why a model's prediction about Pump P17 is not the same as evidence of its condition.
Open interactive →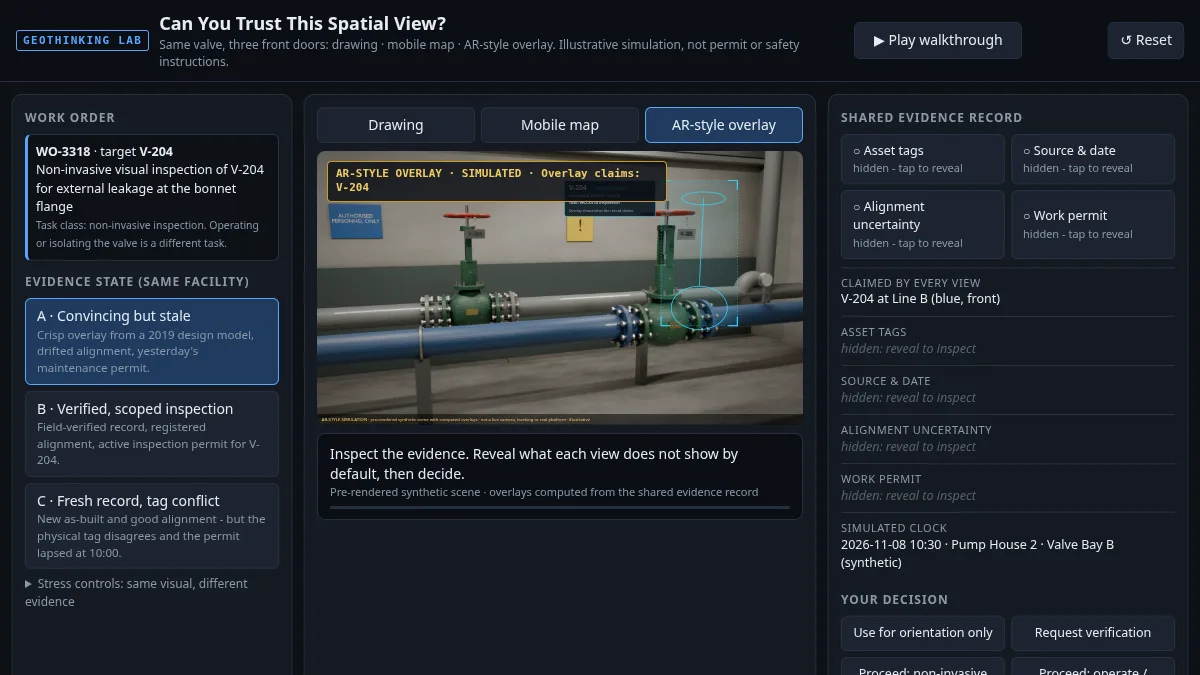
An interactive GeoThinking piece on judging whether a spatial view can be trusted before you act on it.
Open interactive →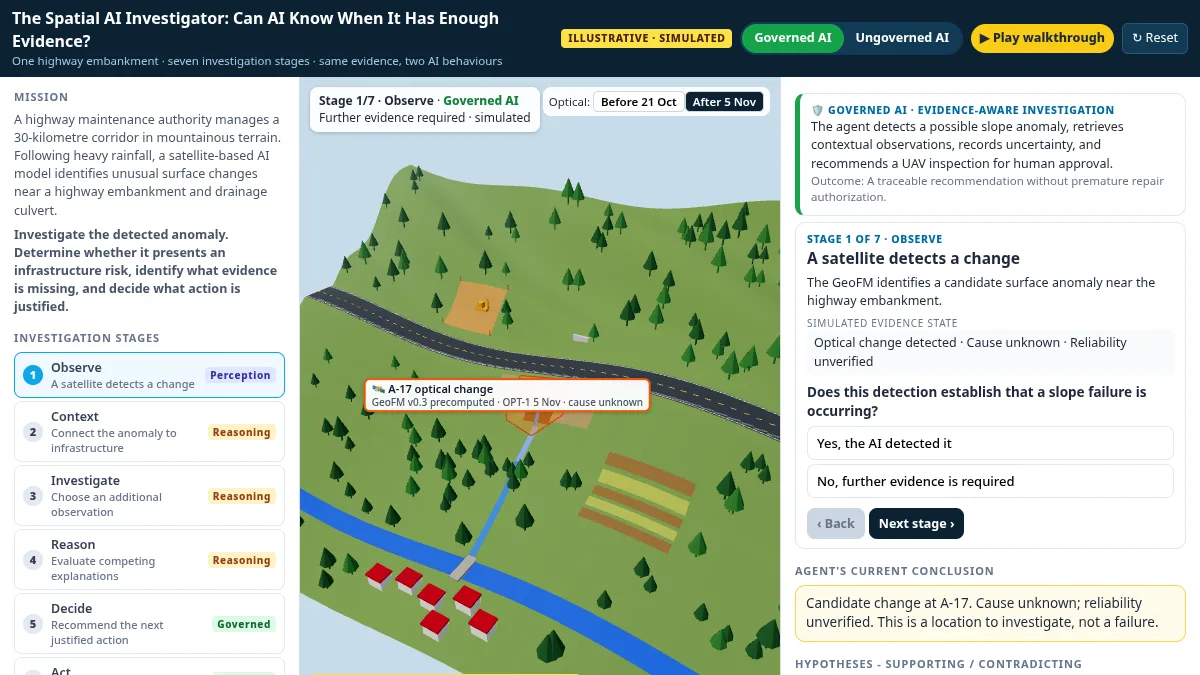
One highway embankment, seven investigation stages, Governed vs Ungoverned AI on the same evidence. Precomputed, simulated observations - illustrative only.
Open interactive →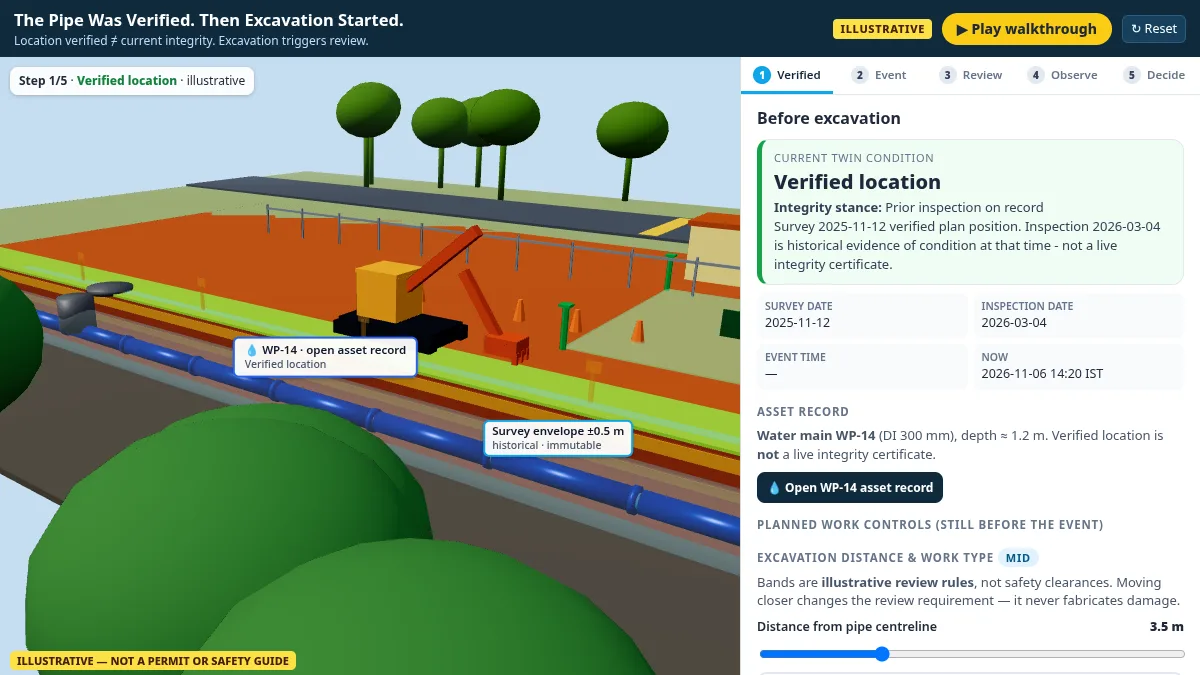
Location was verified. Excavation still triggers review — not an automatic safe status. All values illustrative.
Open interactive →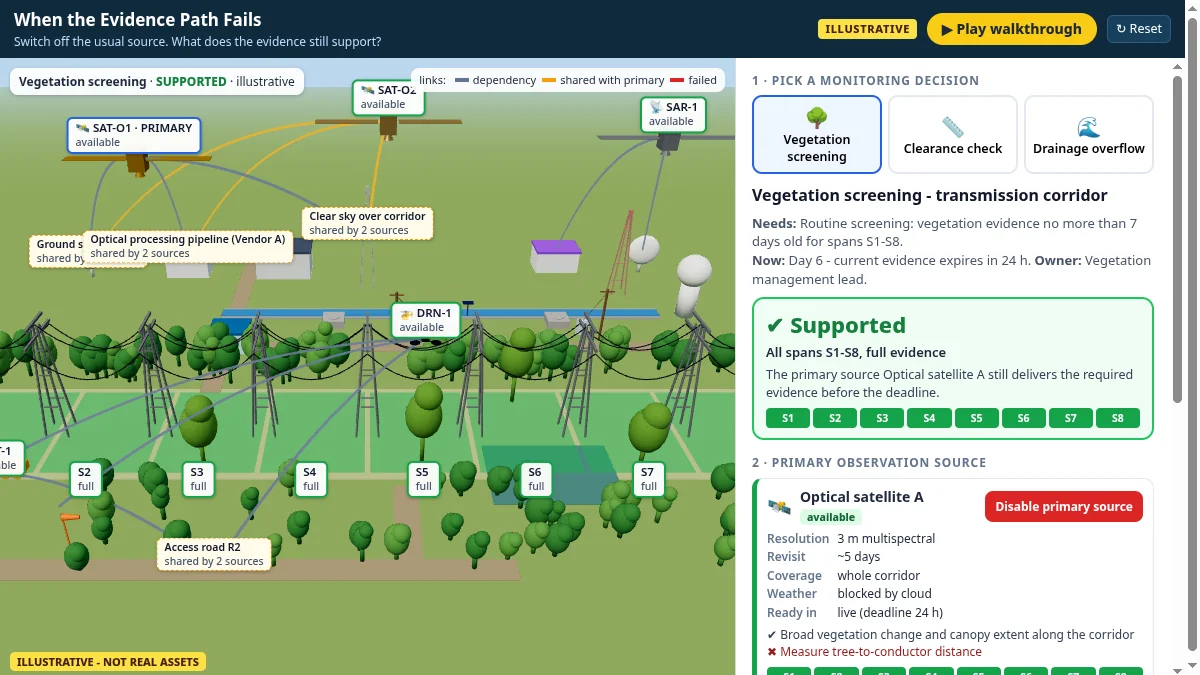
Pick a monitoring decision, switch off its primary observation source, and see whether the decision stays supported, becomes narrower or must be marked unknown. All values illustrative.
Open interactive →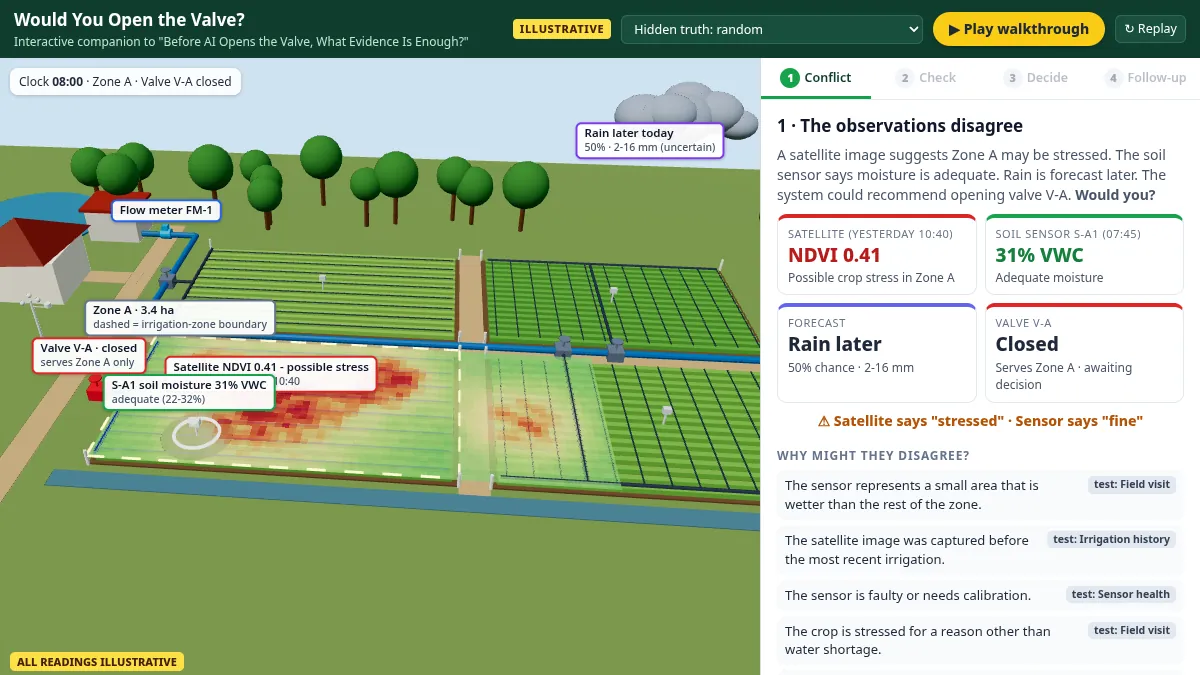
A satellite says Zone A is stressed, the soil sensor says it is fine, and rain may be coming. Walk through an interactive 3D farm, check the conflicting evidence, decide whether to open valve V-A, and see what follows.
Open interactive →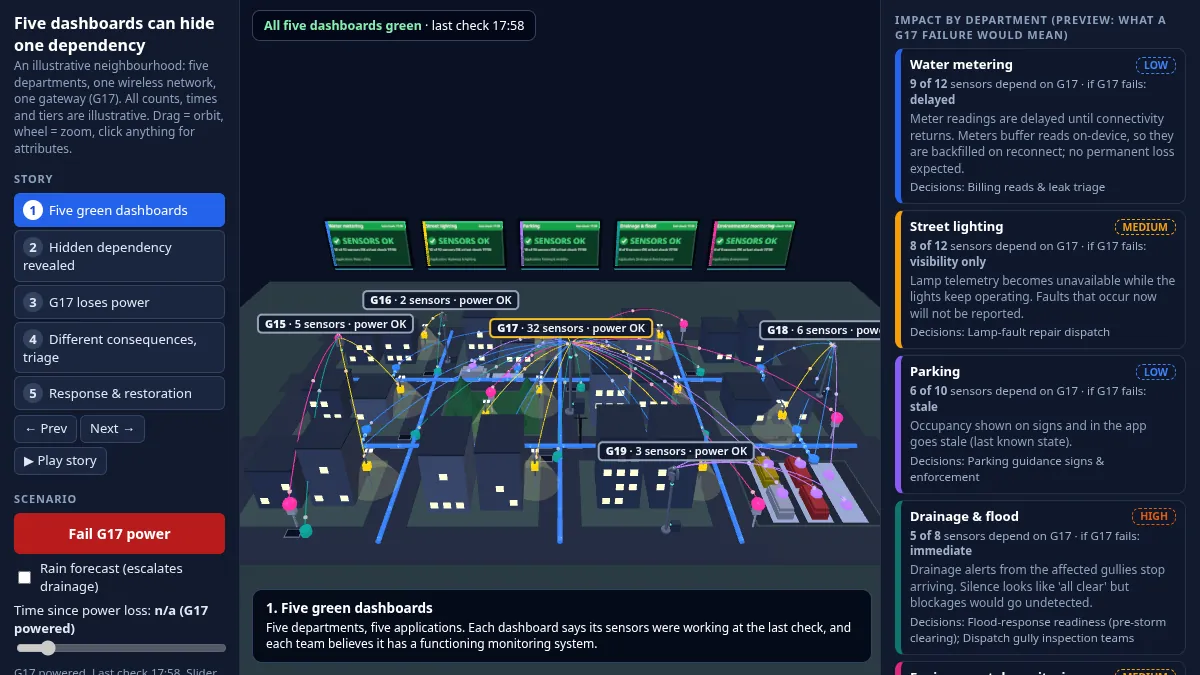
Five city departments, five healthy-looking dashboards, and one shared wireless gateway. Explore an interactive 3D neighbourhood, fail gateway G17 or add a rain forecast, and see which services go dark and which evidence goes missing across departments.
Open interactive →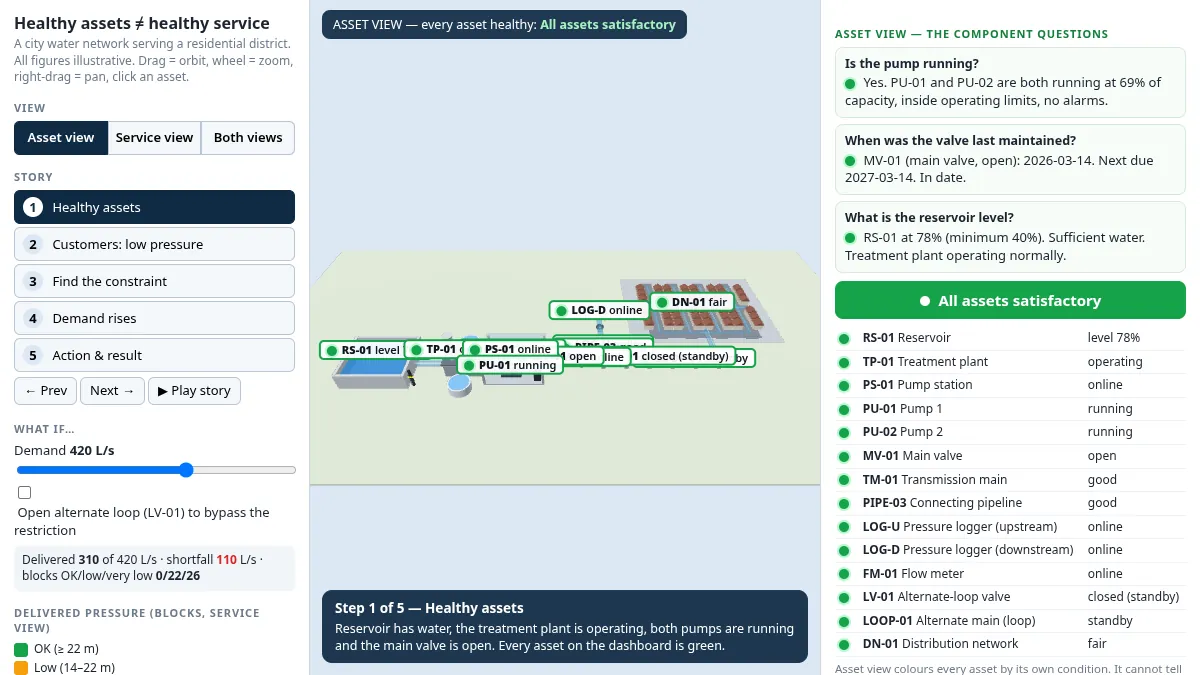
Every asset in a city water network can be healthy while the service still fails. Explore an interactive 3D district to compare the asset view with the service view, step through the story, and test what-if scenarios on demand and a restricted loop.
Open interactive →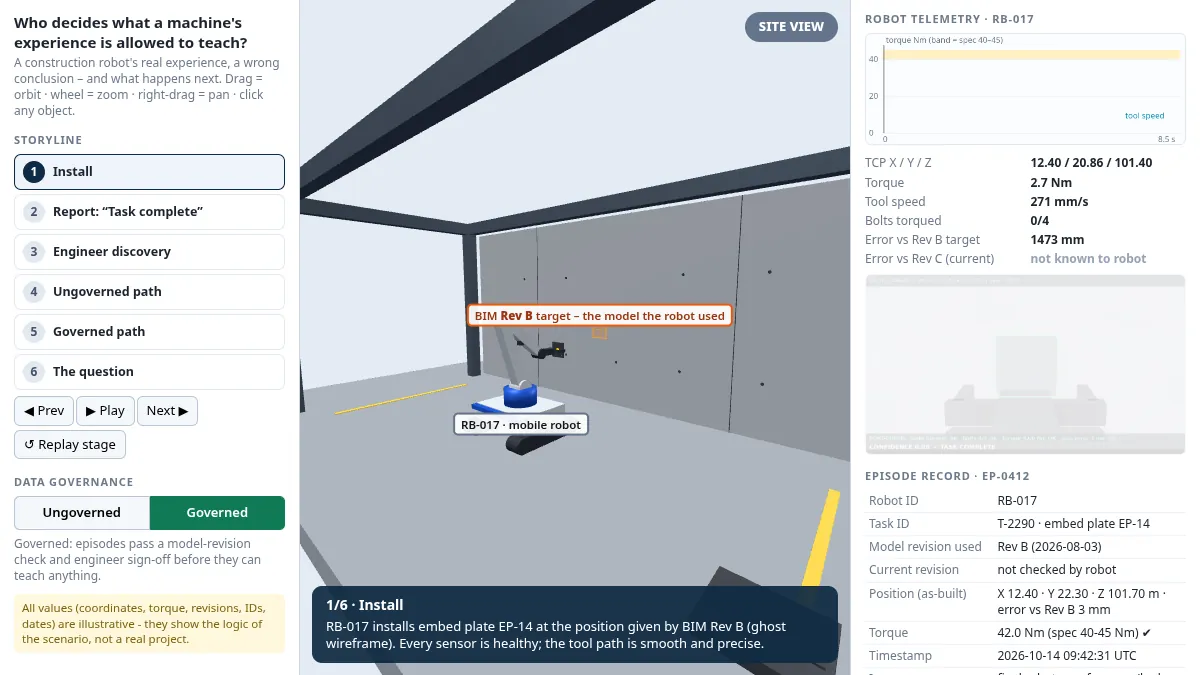
A construction robot's real experience, a wrong conclusion, and what happens next. Step through the storyline and compare ungoverned and governed data handling in an interactive 3D scene.
Open interactive →Continue the conversation